
 (1).svg)
 (1).png)


 (1).svg)
.svg)
When encountering issues with a website, accessing and analyzing error logs is an essential first step for effective identification and resolution. Plesk provides a user-friendly interface that simplifies access to these critical logs, enabling users to pinpoint various errors such as misconfigurations, missing files, and application failures. Diligently reviewing these error logs empowers you to diagnose problems efficiently, ensuring your website operates smoothly and reliably. This comprehensive guide will walk you through the various methods to check error logs within Plesk, streamlining your troubleshooting process and enhancing site stability.
Method 1: Accessing Logs via the Plesk Logs Section (Recommended for General Website Troubleshooting)
This method offers a consolidated view of your website's logs directly within the Plesk interface, making it an ideal starting point for most troubleshooting scenarios.
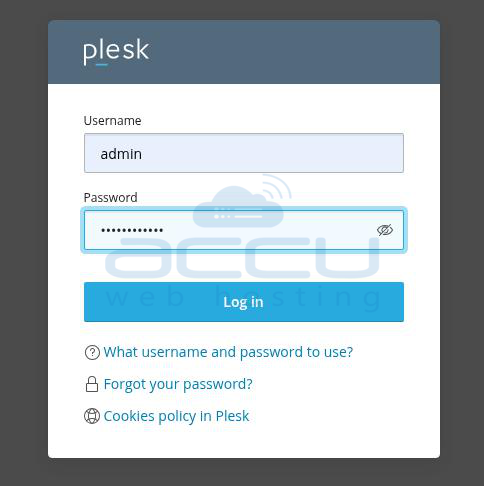
To begin, log in to your Plesk control panel. Utilize the credentials supplied by your web hosting provider to gain access to the dashboard.
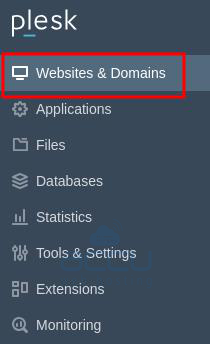
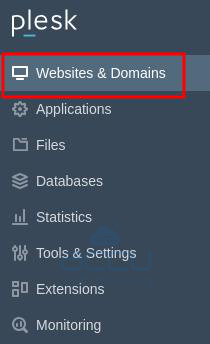
From the main left-hand navigation menu within your Plesk panel, locate and select the Websites & Domains option. This section provides an overview and management tools for all your hosted websites.
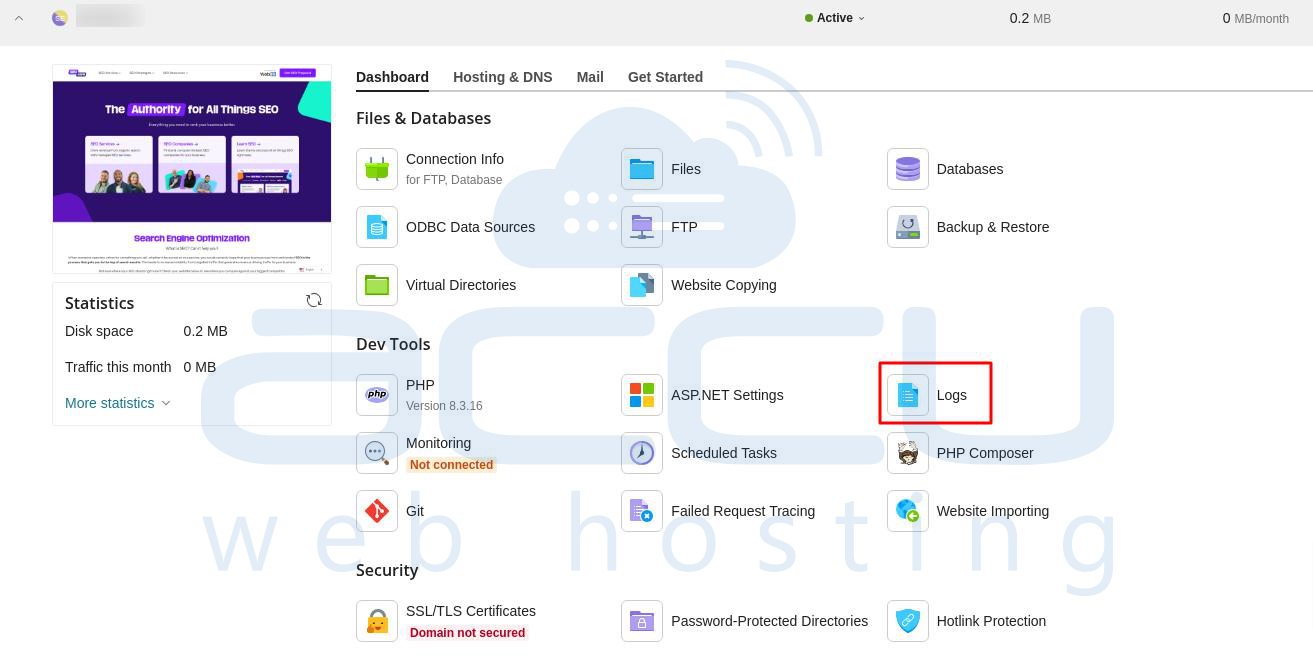
Within the dashboard for your specific website, proceed to the Dev Tools section. Here, you will find and click on the Logs utility, which consolidates various diagnostic outputs.
Once the logs dashboard loads, use the available filtering options to narrow down the entries. Select the 'Errors' filter to display only error-related log messages, allowing for focused troubleshooting.
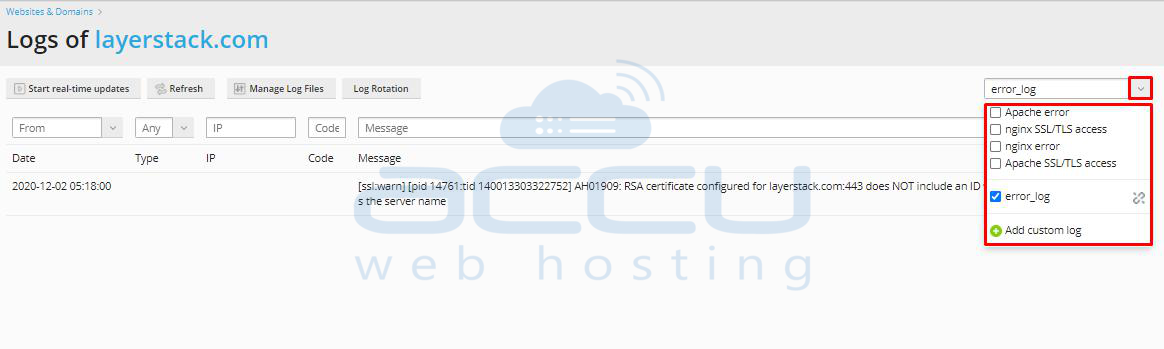
At this stage, you have the flexibility to either download the complete log files for more in-depth analysis using external tools or view the logs in real time directly within the Plesk interface for immediate insights.
Method 2: Manual Log Inspection via Plesk File Manager
For more granular control or when specific log files are needed, directly accessing logs through the File Manager can be highly effective.
Access your Plesk control panel by logging in with the credentials provided by your web hosting provider.
From the left-hand navigation pane, select Websites & Domains to manage your site's settings.
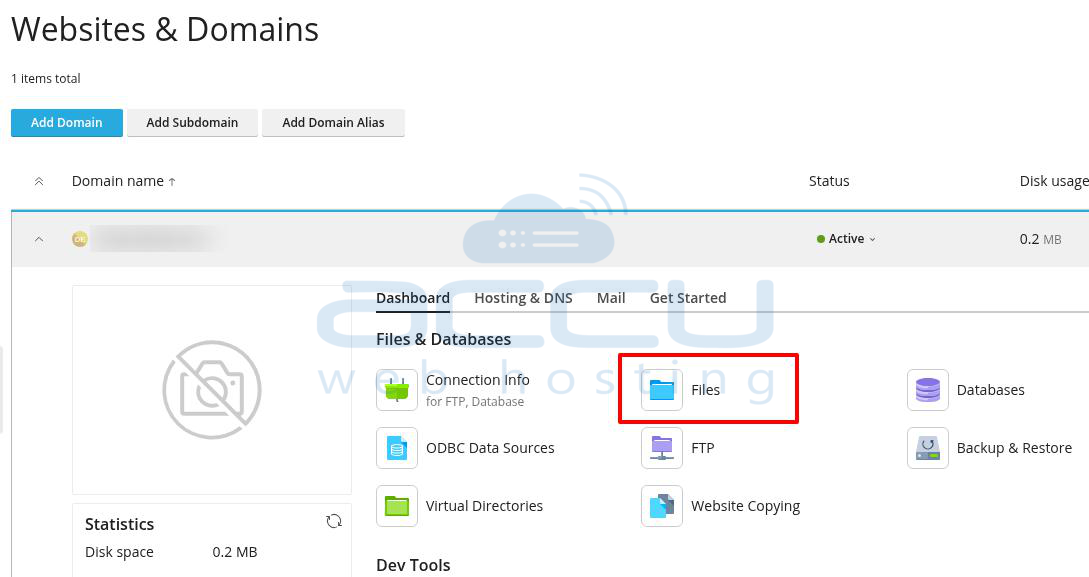
Within the dashboard for your particular website, locate and click on the Files option. This will open the File Manager, giving you direct access to your website's directory structure.
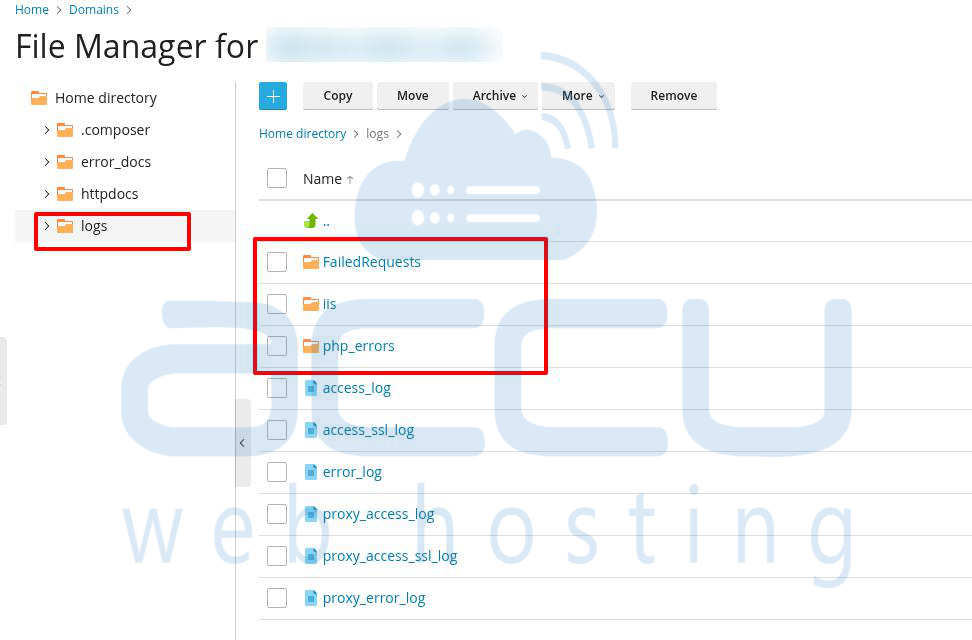
Once inside the File Manager, navigate through your website's directory structure to locate the
logsdirectory. This directory is typically where various system and application logs are stored. Inside, you will commonly find three distinct subfolders, each serving a specific logging purpose:- FailedRequests: Contains logs detailing failed IIS requests, which are invaluable for diagnosing server-side issues.
- iis: Houses general IIS logs, offering insights into web server activity and potential errors.
- php_errors: Dedicated to PHP-related error logs, crucial for troubleshooting scripting issues within your web application.
If your troubleshooting specifically targets PHP-related errors, proceed to open the
php_errorsfolder. This directory will contain logs pertinent to PHP script execution.Within the
php_errorsfolder, search for files namederror_logor any other files ending with the.logextension. These files hold the detailed error messages generated by PHP.Conversely, if you are diagnosing issues related to IIS (Internet Information Services), navigate into the
iisfolder. Here, examine the most recent log files (typically with a.logextension) to review server activity and identify anomalies.You have the option to open these log files directly within the Plesk File Manager for immediate viewing, or you can download them to your local machine for more comprehensive analysis using a text editor or specialized log analysis tools.
Method 3: Enabling and Reviewing stdoutLog for IIS / ASP.NET Core Applications in Plesk
The stdoutLog feature is particularly beneficial for diagnosing both startup and runtime issues within applications, especially those developed with ASP.NET Core and hosted on an IIS server. Enabling this log provides crucial output that can help pinpoint complex application behaviors.
Initiate by logging into your Plesk control panel, then proceed to the Websites & Domains section.
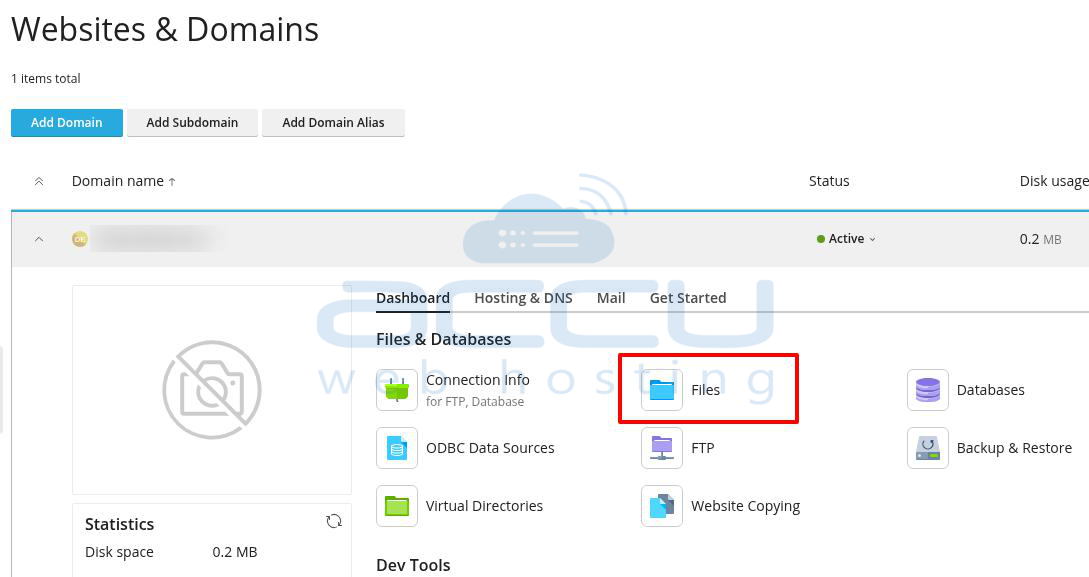
Next, click on the Files button. This action will launch the File Manager, granting you access to your application's file structure.
Within the File Manager, navigate to the root directory of your application. Locate the
web.configfile, which is a crucial configuration file for IIS applications, and open it for editing. Once opened, find the<aspNetCore>section within the file. You will need to modify or add thestdoutLogEnabledandstdoutLogFileattributes as demonstrated in the example below, to enable and specify the path for the stdout log:<aspNetCore processPath="dotnet" arguments="MyApp.dll" stdoutLogEnabled="true" stdoutLogFile=".\logs\stdout" hostingModel="inprocess"> </aspNetCore>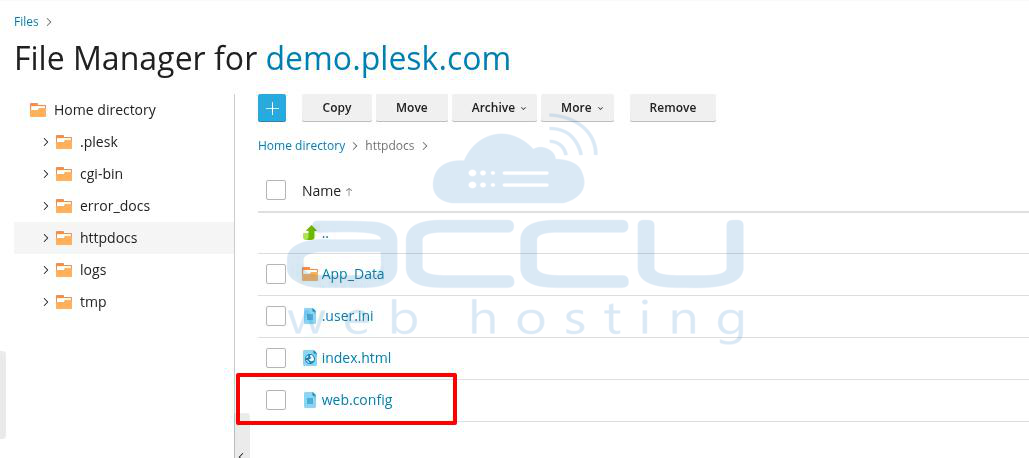
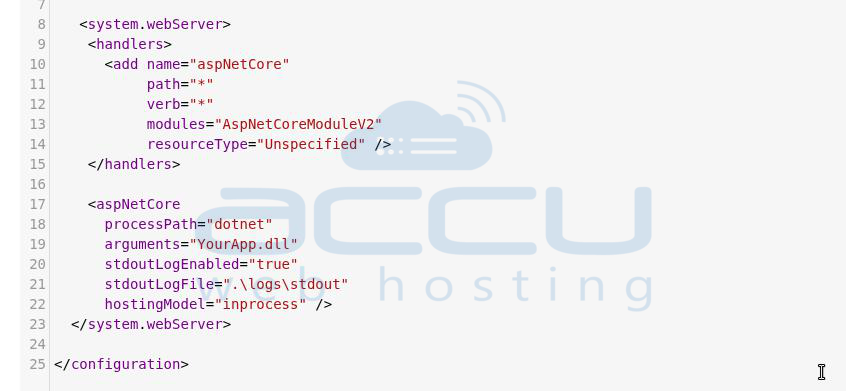
After saving the changes to your
web.configfile, return to the File Manager. Navigate to thelogsdirectory within your application's root. Here, you should now find the newly generatedstdoutlog files, reflecting the output from your ASP.NET Core application.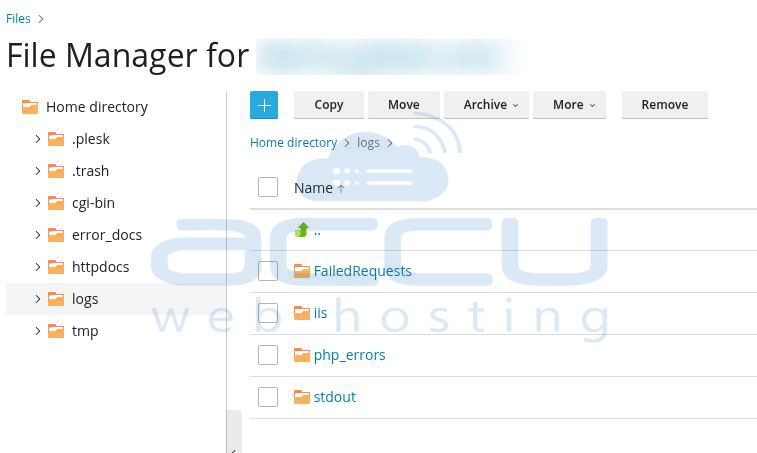
Open these
stdoutlog files to meticulously review their contents. This log data is invaluable for identifying specific issues such as application startup failures, problems with missing dependencies, or any runtime exceptions that may be hindering your application's performance or functionality.
In conclusion, proactive and effective troubleshooting fundamentally begins with a thorough review of error logs. Plesk significantly streamlines this essential process, offering multiple convenient approaches. Whether you opt for the integrated Logs section for a quick overview or prefer to manually inspect individual log files through the File Manager, both methods are highly effective in pinpointing critical issues such as failed web requests, specific PHP errors, or IIS server misconfigurations. Establishing a routine practice of regularly checking these logs is not only vital for promptly resolving existing problems but also serves as a crucial preventative measure against potential future errors, ultimately contributing to the stability and reliability of your website.