 (1).svg)
 (1).png)


 (1).svg)
.svg)
One of the most valuable features within cPanel is its capability to help you monitor the resources consumed by your websites. Diligently tracking your resource usage is crucial for preventing system overload and ensuring your website operates efficiently and smoothly.
Accessing Resource Usage Statistics in cPanel
To begin monitoring your resource usage, you will first need to log into your cPanel account. Once logged in, you will typically find the Statistics bar conveniently located on the right side of your screen. This section provides an immediate overview of your hosting environment.
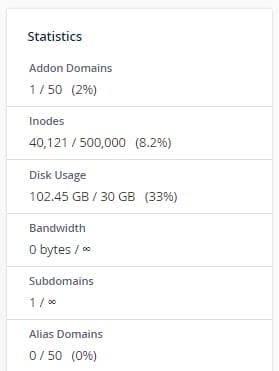
The Statistics section offers a concise summary of several key metrics, including disk usage, the number of email accounts, inode count, and more. It serves as a general overview of the resources currently in use by your hosting plan. Below is a comprehensive list of the metrics typically found within the Statistics sidebar:
- Addon Domains – This indicates the total number of additional domains that have been successfully added to your hosting plan.
- Inodes – Inodes represent the total count of all files and directories stored on your hosting plan. For example, a single email message counts as one inode, while an email with two attachments would count as three inodes (one for the email, one for each attachment).
- Disk Usage – This metric shows the amount of storage space currently occupied by your website's files, databases, emails, and ongoing processes.
- Bandwidth – Bandwidth measures the total amount of data transferred to and from your hosting plan over a month. Exceeding your allocated bandwidth can impact site performance.
- Subdomains – This refers to the total number of subdomains you have created under your primary domain.
- Email accounts – This displays the number of active email accounts you have set up under your hosting plan.
- Autoresponders – This shows the count of automatic reply messages configured for your email accounts.
- Forwarders – This indicates the number of email forwarders established within your email accounts, directing incoming mail to different addresses.
- Email Filters – This represents the number of email filters you have configured for your account, along with their respective usage limits.
- FTP Accounts – This shows the number of File Transfer Protocol (FTP) accounts created, which are used for uploading and managing website files.
- MySQL Databases – This metric displays the current number of databases you are utilizing and the maximum limit allowed for your hosting plan. This is a critical metric as it directly influences your website's performance and disk space consumption.
- CPU Usage – This shows the percentage of CPU power being consumed by your hosting plan, providing insight into the processing demands of your website.
- Entry Processes – This represents the number of PHP processes actively executing to handle incoming requests to your website. A high number here can indicate performance bottlenecks.
- Physical Memory Usage – This indicates the amount of physical memory (RAM) currently being utilized by your hosting plan's processes.
- IOPS – Input/Output Operations Per Second (IOPS) measures how much data is read from and written to your hosting plan's storage each second. This is a key indicator of disk performance.
- I/O Usage – This displays the total amount of input and output operations being used by your hosting plan.
- Number of Processes – This shows the total count of currently running processes on your hosting account.
Delving Deeper with the Resource Usage Section
For a more in-depth analysis and detailed metrics beyond the general statistics, navigate to the Resource Usage section within cPanel. This area provides comprehensive insights into your resource consumption patterns.
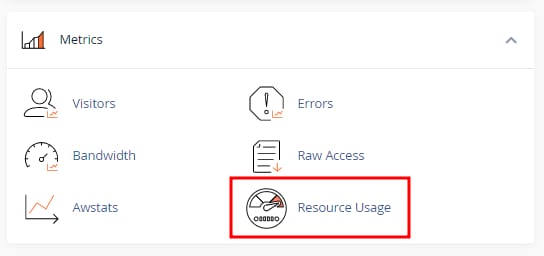
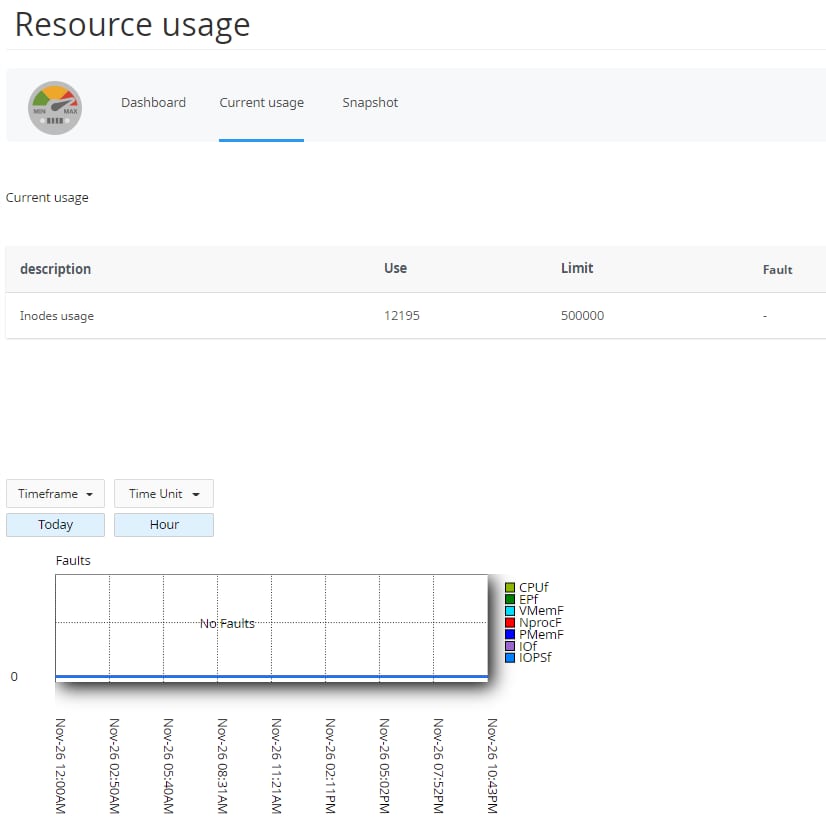
Once you access the Resource Usage section, click on the Current usage tab. Here, you will find detailed information presented in a graphical format, offering a visual representation of your hosting plan's resource consumption over time. These graphs are invaluable for identifying trends and potential issues.
Understanding Faults in Resource Usage Graphs
The Faults graph within the Resource Usage section provides critical information regarding potential resource limitations and issues. Each metric in this graph represents a specific type of 'fault' or resource threshold being hit. Understanding these can help diagnose performance problems:
- CPUf – This represents the average CPU usage in percentage faults. A high value here indicates that your hosting plan is frequently hitting its CPU limits, potentially causing slowdowns.
- EPf – This refers to average entry processes or concurrent web server request faults. If this value is high, it means your website is frequently exceeding the maximum number of simultaneous requests it can handle.
- VMemF – This value indicates the maximum amount of virtual memory allocated by process faults. Consistent high readings suggest processes are requesting more memory than available.
- NprocF – This refers to new processes created faults. A high number can suggest that too many new processes are being spawned, which can consume significant resources.
- PMemF – This signifies physical memory failures, occurring when processes attempt to allocate excessive amounts of memory, leading to situations where new client requests cannot be adequately served.
- IOf – This represents timed out usual data written time. A high count here suggests that input/output operations are taking longer than expected to complete.
- IOPSf – This indicates timed out amounts of usual data written. This metric points to issues where the system is failing to meet the required input/output operations per second.
By regularly monitoring these detailed graphs and understanding the meaning behind each metric, you can effectively manage your hosting resources, optimize your website's performance, and proactively address any potential issues before they impact your users.
